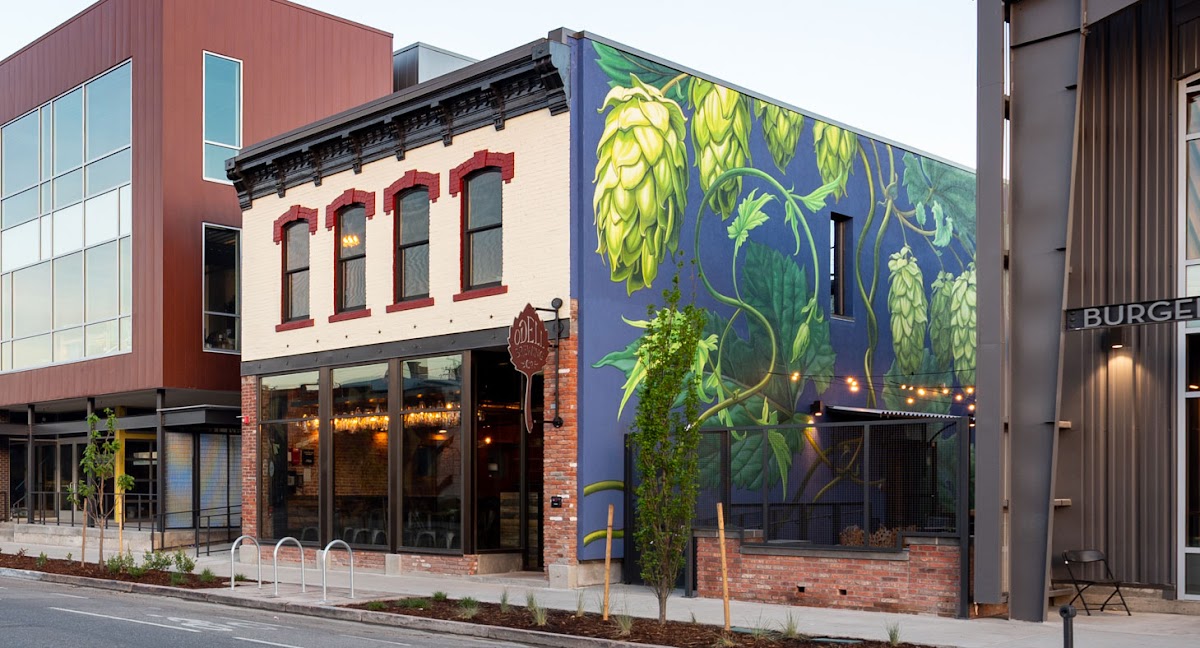
Photo: Jerry Jaramillo, Al Sanchez, Carlos Sandoval & Stevon Lucero — La Familia Cosmica
One crash with a death was logged in Denver from Friday, October 16, 2026 to Thursday, October 22, 2026, according to the city's open data. The same data puts the week at 371 crashes citywide, the lowest of the last eight weeks, against a high of 442 in the week ending October 8, 2026. A crash count shows how much traffic a place carries as well as how risky it is, so read these as counts of police reports, not rates.
Crashes fell to the low of the eight-week series
The eight weekly counts ran 428, 434, 396, 435, 426, 442, 434 and 371. The first seven stayed in a narrow band, and the latest week broke below all of them. Anyone comparing next week's number should start from 371, not from the 430s that had become the norm.
View as table
| Week ending | Crashes in the seven days ending |
|---|---|
| September 3 | 428 |
| September 10 | 434 |
| September 17 | 396 |
| September 24 | 435 |
| October 1 | 426 |
| October 8 | 442 |
| October 15 | 434 |
| October 22 | 371 |
Source: City and County of Denver open data: traffic accidents, data as of
Key takeaways
- Citywide crashes were down 14.5% on the week before and down 13.3% on the same week last year.
- Crashes with a death numbered 1, after none the week before and none in the same week last year.
- Crashes with a serious injury fell to 4, against 10 in the same week last year.
- Crashes involving a person on foot fell to 10, down 28.6% on the week before.
- Crashes involving a person on a bicycle rose to 5, up 66.7% on the week before.
One death and four serious-injury crashes this week
The dataset logs the single fatal crash with no cause or fault attached. Serious-injury crashes dropped from 5 the week before to 4, and from 10 a year earlier, a 60% drop on the year.
Pedestrian crashes ran the opposite way from bicycle crashes. People on foot were involved in 10 crashes, against 14 the week before and 16 last year. People on bicycles were involved in 5, against 3 the week before and 4 last year. The dataset records involvement only and does not say who was at fault.
View as table
| Kind of crash | This week |
|---|---|
| Death Week before: 0 | 1 |
| Serious injury Week before: 5 | 4 |
| Person on foot Week before: 14 | 10 |
| Person on a bicycle Week before: 3 | 5 |
Source: City and County of Denver open data: traffic accidents, data as of

Central Park and Baker led; Hampden South jumped
Central Park had the most crashes of any neighborhood, 24, down from 35 the week before. Baker followed with 22, and Capitol Hill logged 14, up from 10.
Hampden South moved the most, to 14 crashes from 2 the week before. Sunnyside went to 10 from 4, and Elyria Swansea to 11 from 5.
Two neighborhoods moved down sharply. Civic Center fell to 5 from 13, and Lincoln Park to 8 from 15.
View as table
| Neighborhood | This week |
|---|---|
| Central Park Week before: 35 | 24 |
| Baker Week before: 26 | 22 |
| Capitol Hill Week before: 10 | 14 |
| Hampden South Week before: 2 | 14 |
| Gateway Green Valley Ranch Week before: 15 | 12 |
| Elyria Swansea Week before: 5 | 11 |
| Montbello Week before: 20 | 11 |
| Five Points Week before: 17 | 10 |
Source: City and County of Denver open data: traffic accidents, data as of
Five Points, this edition's spotlight, had 10 crashes, down from 17 the week before, at 6.9 crashes per square kilometre. The Denver traffic accidents map shows where the neighborhood's crashes fall.
Addresses with the most crashes carry the most traffic
Over the twelve months from Thursday, October 23, 2025 to Thursday, October 22, 2026, northbound I-25 at W 6th Ave had 225 crashes. Eastbound I-70 at N Peoria St had 110, and N Federal Blvd at W 6th Ave had 91.
Those numbers track volume as much as risk, since these are some of the busiest connections in the city. An address with many crashes is a design question for the people who build the road, not a verdict on the drivers who passed through.
View as table
| Address | Crashes |
|---|---|
| I25 Hwynb / W 6th Ave | 225 |
| I70 Hwyeb / N Peoria St | 110 |
| N Federal Blvd / W 6th Ave | 91 |
| I70 Hwyeb / N Havana St | 85 |
| I225 Hwysb / I70 Hwyeb | 84 |
| I25 Hwynb / W 23rd Ave | 84 |
| I70 Hwyeb / N Pecos St | 72 |
| 20th St / I25 Hwysb | 71 |
Source: City and County of Denver open data: traffic accidents, data as of
What to watch next week
The number to beat is 371. If next week lands in the 400s, the low was a one-week dip; if it stays near 371, the series has a new floor. Check Hampden South's 14 and Five Points' 10 on the traffic accidents map to see whether the week's movers hold.
Methodology
The figures are crashes reported to Denver Police and published in the city's open data, in a rolling extract pulled October 27, 2026. They cover Friday, October 16, 2026 to Thursday, October 22, 2026, against Friday, October 9, 2026 to Thursday, October 15, 2026 and the same week last year.
A crash never reported, or not yet published, is not counted. Counts are not adjusted for traffic volume, so they cannot say which place is more dangerous. The dataset records that a person on foot or on a bicycle was involved but does not say who was at fault.
Corrections
Errors are corrected in public; send a correction to hello@303happenings.com.