
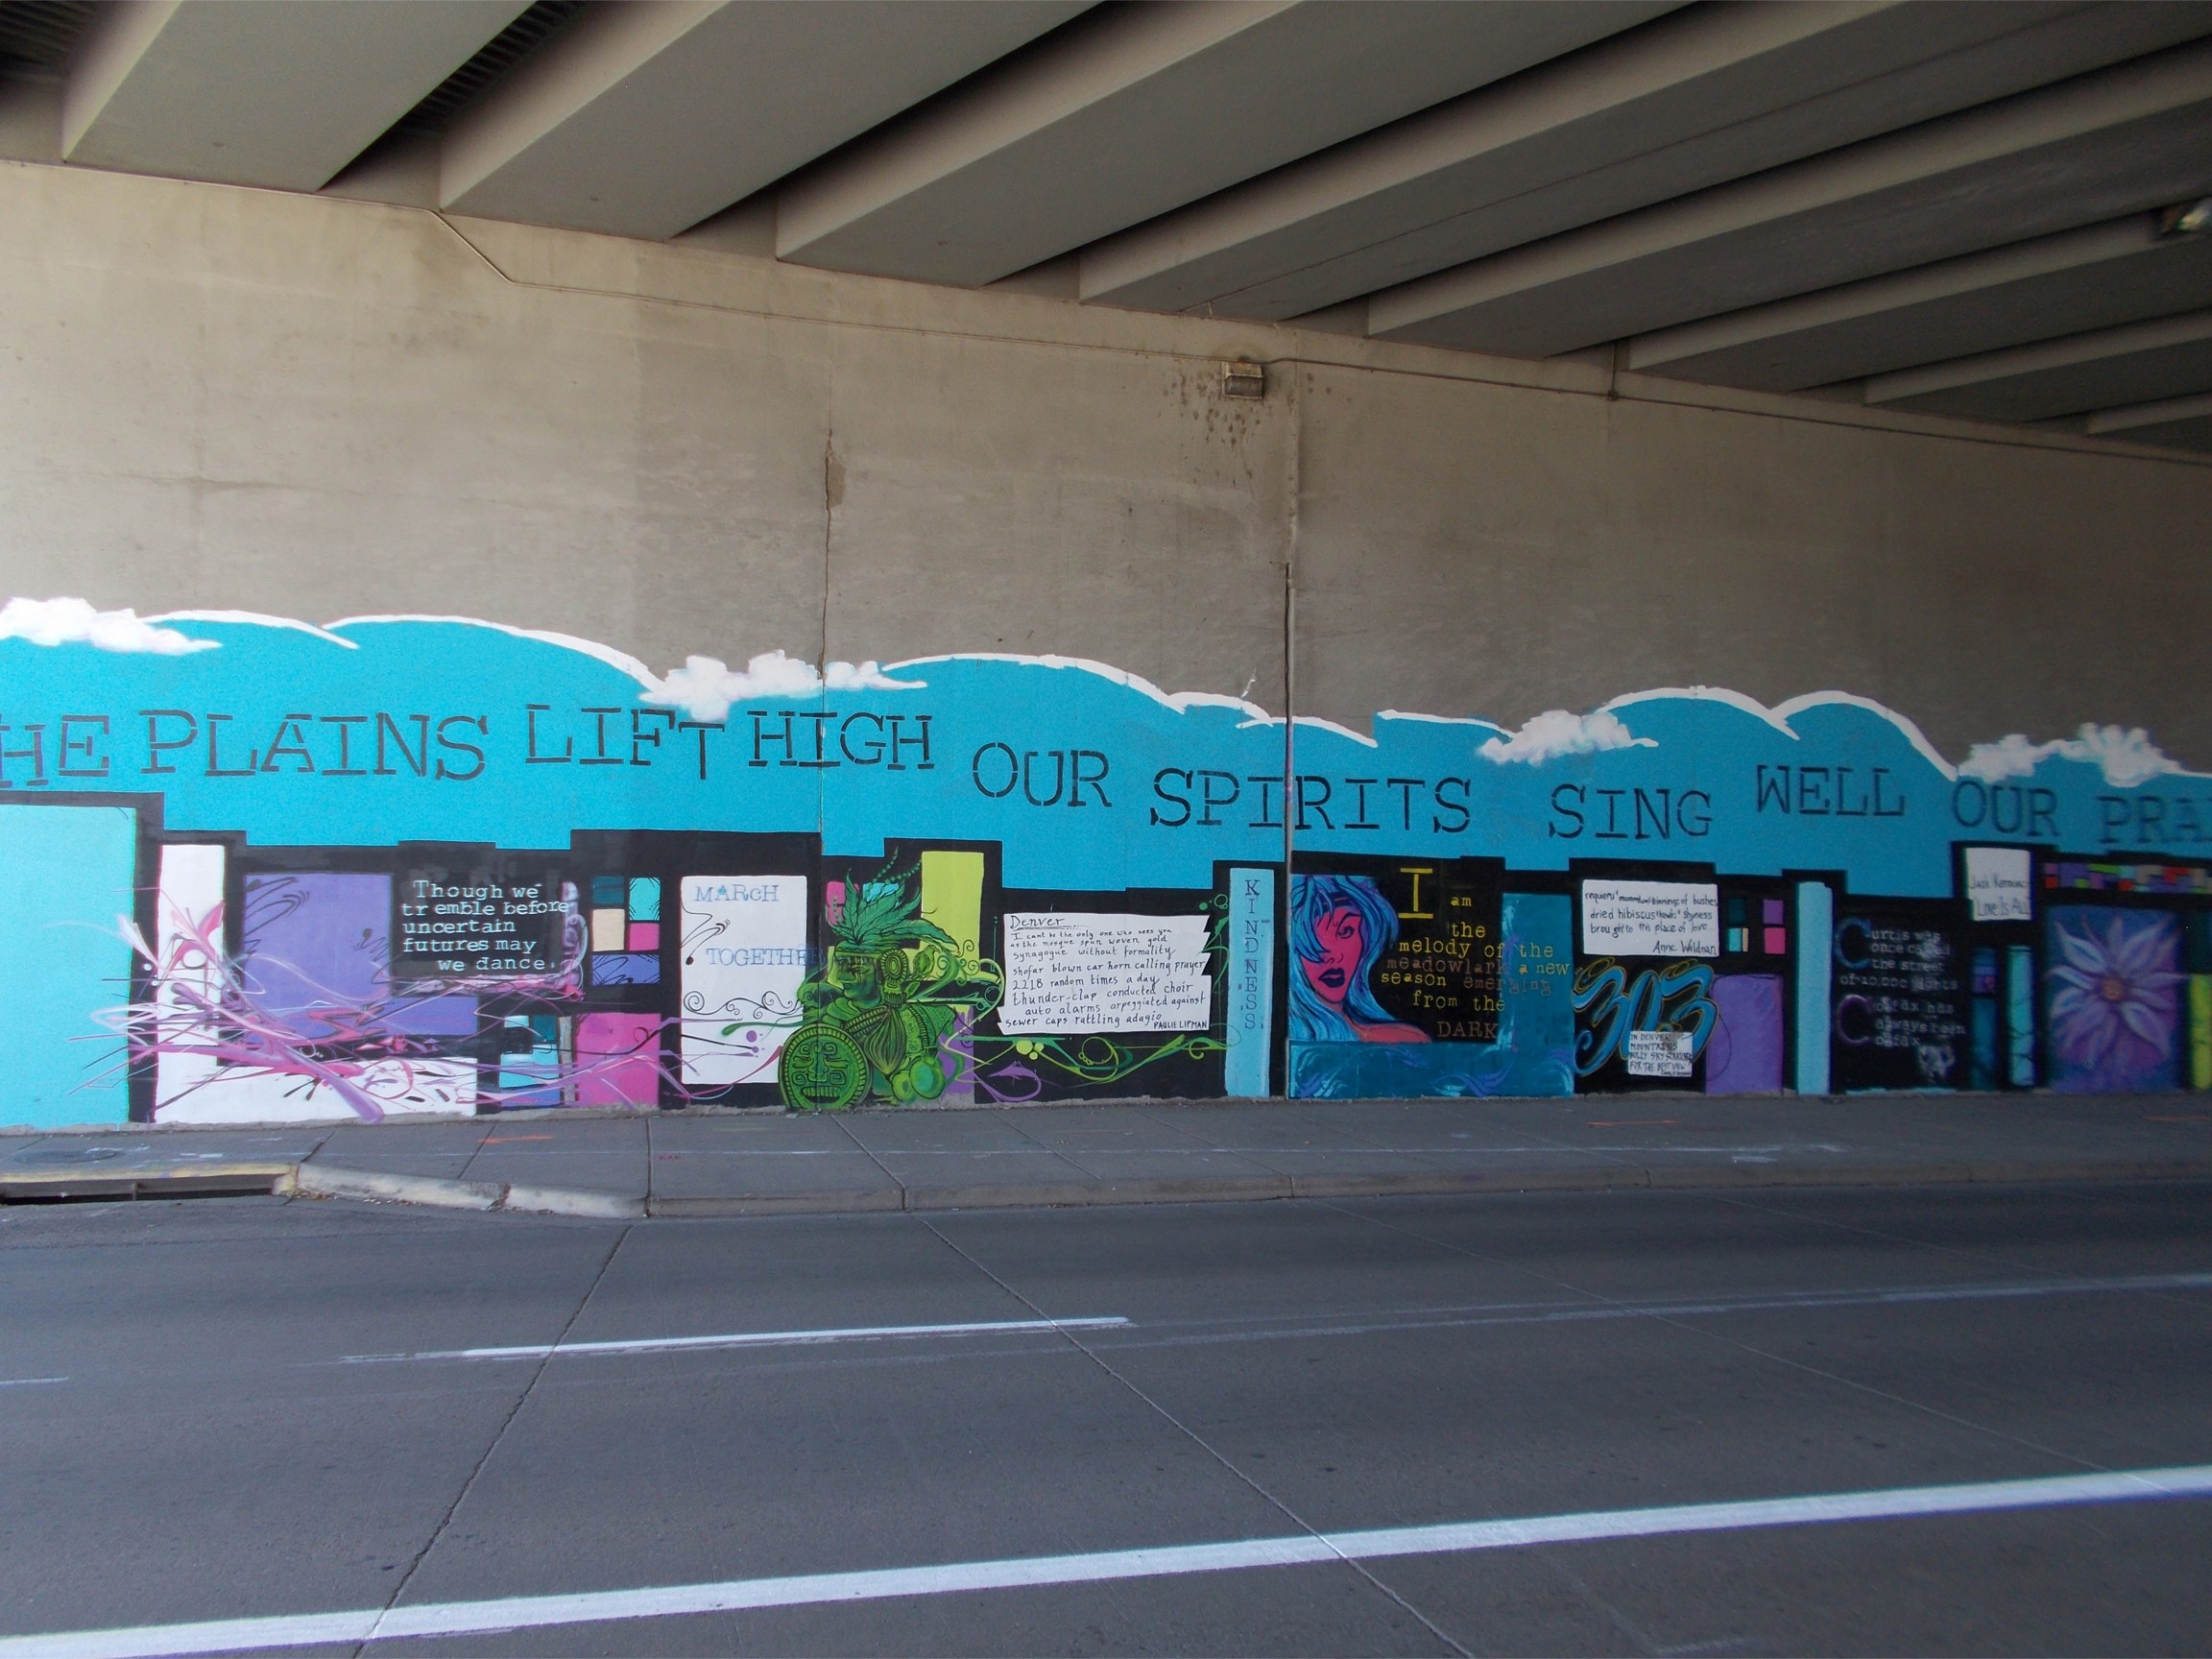
Photo: Emanuel Martinez — Eyes on the Park
Five Points logged 94 Denver Police reports from Tuesday, October 13, 2026 to Monday, October 19, 2026, the most of any neighborhood in the city's open data. Union Station's 180.5 reports per square kilometre is the densest figure in the table. Count and density tell different stories, and this Denver crime report sets them side by side.
Key takeaways for the week
- Denver Police took 1,009 reports, down 16.4% on the same week last year.
- Larceny was the largest category at 184 reports, down 25.8% on the week before.
- Auto theft rose 29% on the week before, the sharpest climb among the larger categories.
- Capitol Hill, this week's spotlight, logged 30 reports against 51 the week before.
Busiest and densest neighborhoods are not the same list
Ranked by count, Five Points leads, followed by Central Park with 47 reports and Union Station with 41. Ranked by reports per square kilometre, the order changes. Union Station comes first at 180.5, Civic Center follows at 72.4, and Five Points sits at 64.5.
Central Park shows the gap most clearly. It had more reports than Union Station, yet its 9.7 per square kilometre is the lowest of the four. A large neighborhood spreads its reports over more ground. A small downtown district packs them into a few blocks.
The density figure uses the city's own neighborhood areas, which the open data provides for some neighborhoods and not others. It describes where reports were filed. It does not describe risk.
Citywide reports fell for a third straight week
Police logged 1,009 reports against 1,109 the week before (October 6 to October 12) and 1,207 in the same week last year (October 13, 2025 to October 19, 2025). The eight-week series opens at 1,292 for the seven days ending August 31 and has slid since the 1,228 of the week ending September 28.
View as table
| Week ending | Reports in the seven days ending |
|---|---|
| August 31 | 1,292 |
| September 7 | 1,185 |
| September 14 | 1,294 |
| September 21 | 1,206 |
| September 28 | 1,228 |
| October 5 | 1,117 |
| October 12 | 1,109 |
| October 19 | 1,009 |
Source: City and County of Denver open data: crime, data as of
Three categories moved most. Larceny fell from 248 to 184 week on week. Auto theft climbed from 62 to 80. Drug alcohol reports stood 72.9% above last year's 48, though the base is small.
View as table
| Category | This week |
|---|---|
| Larceny Week before: 248 | 184 |
| All other crimes Week before: 179 | 178 |
| Public disorder Week before: 175 | 163 |
| Theft from motor vehicle Week before: 114 | 102 |
| Drug alcohol Week before: 95 | 83 |
| Auto theft Week before: 62 | 80 |
Source: City and County of Denver open data: crime, data as of
The previous edition, on larceny and the category mix, had larceny at the top of the list as well.
Why a large or visited district logs more reports
Transparent.city divides offense records by estimated residents for January 1 to September 30, 2026. DIA comes out at 41.9 records per 100 estimated residents, against 3,923 estimated residents. Civic Center comes out at 30.5 per 100, against 4,547.
Five Points shows 15.1 per 100 and Central Park 7.5 per 100. Five Points had the most offense records of any mapped neighborhood in that window, 3,646, yet sits well below DIA and Civic Center on the per-resident measure.
A district with an airport or a government complex draws thousands of people who are not residents, so it files more reports against a small resident base. That makes the count larger without saying anything about the risk to those who live or work there. DIA also rose from 28 to 38 reports this week.
View as table
| Neighborhood | This week |
|---|---|
| Five Points Week before: 76 | 94 |
| Central Park Week before: 51 | 47 |
| Union Station Week before: 42 | 41 |
| DIA Week before: 28 | 38 |
| East Colfax Week before: 42 | 33 |
| Capitol Hill Week before: 51 | 30 |
| North Capitol Hill Week before: 30 | 30 |
| Gateway Green Valley Ranch Week before: 31 | 28 |
Source: City and County of Denver open data: crime, data as of
The Denver crime map shows where the reports fall block by block.
Capitol Hill dropped from 51 to 30 reports
Capitol Hill, the spotlight neighborhood, logged 30 reports, down 41.2% on the week before, at 14.3 reports per square kilometre. North Capitol Hill also logged 30, level with its prior week.
The year-to-date picture differs. Transparent.city reports Capitol Hill incidents rising from 267 to 543 between January 1 and October 4, 2026 against the same window of 2025, and ties the rise to drug and alcohol records. One quiet week does not undo that.
Five neighborhoods rose most on the week before, each from a small base. Congress Park went from 3 to 10, Harvey Park from 4 to 12, Overland from 4 to 10, Baker from 9 to 17 and Globeville from 9 to 16. A change of a few reports is not a trend. Transparent.city puts Baker's incidents at 154 for January 1 to October 4, 2026, up from 48 in the same window of 2025.
What to watch next week
Compare next week's citywide count with this week's 1,009 on the weekly figures page. Auto theft at 80 and Five Points at 94 are the two numbers to check for a second week of movement, and the Denver crime map shows where they land.
Methodology
The counts come from Denver Police reported-offence data in the City and County of Denver open data, pulled October 21, 2026. The week covered runs Tuesday, October 13, 2026 to Monday, October 19, 2026. The week before runs Tuesday, October 6, 2026 to Monday, October 12, 2026. The same week last year runs Monday, October 13, 2025 to Sunday, October 19, 2025.
The dataset leaves out homicide and sexual assault, so totals understate serious violence. Counts are reports, not convictions or rates. A rise can mean more reporting rather than more crime.
Neighborhood counts follow the city's boundaries and are not adjusted for population or visitors. Per-resident figures come from Transparent.city for the windows it states.
Corrections
Errors are corrected in public; send one to hello@303happenings.com.